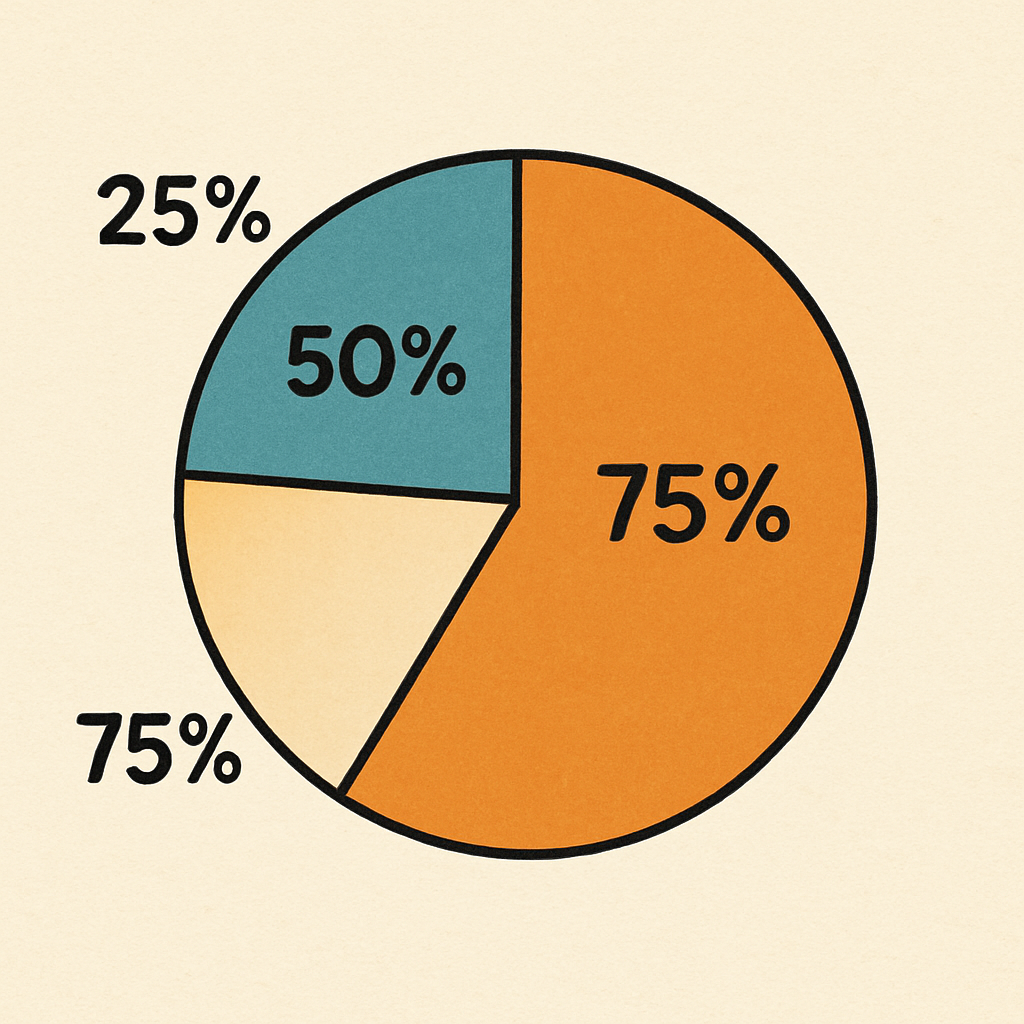
Percentage Problems in Data Interpretation
Data interpretation means understanding information shown in numbers, charts, and tables. Percentage problems are a big part of this because percentages help us compare parts of data quickly and clearly. Learning how to solve percentage problems in data interpretation can make it much easier to understand what data is telling us in everyday life, school, or work.
Why Are Percentages Important in Data Interpretation?
Percentages show information in a way that is easy to compare, no matter what the total number is. For example, if one company makes 50 cars and another makes 100, using percentages like 25% or 50% helps us know who makes more compared to their production capacity.
When reading graphs or tables, understanding percentages helps answer questions like:
- What part of the whole does this number represent?
- How much did a value increase or decrease?
- What percentage of people chose a certain option?
Common Percentage Problems in Data Interpretation
1. Finding Percentage from the Data
You may be given total numbers and parts, and then asked to find what percentage the part is of the whole.
Example:
In a class of 40 students, 10 students like soccer. What percentage of students like soccer?
Calculation: (10 / 40) × 100 = 25%
So, 25% of students like soccer.
2. Calculating Increase or Decrease in Data
Sometimes data shows an increase or decrease, and you need to find the percentage change.
Example:
Last year, a store sold 500 items. This year, it sold 600 items. What is the percentage increase?
Calculation: ((600 - 500) / 500) × 100 = 20% increase.
If sales dropped, you calculate the percentage decrease the same way.
Tip: Use a percentage deduction calculator to quickly find how much a value has dropped or changed!
3. Comparing Percentages
Data might show percentages in different categories, and you need to compare them to find the largest or smallest group or to calculate combined percentages.
Example:
If 40% of people like apples and 30% like oranges, how many more people like apples?
You can calculate the difference directly in percentage points: 40% - 30% = 10%.
This means 10% more people prefer apples.
How to Solve Percentage Problems Step-by-Step
Read the data carefully: Identify the total and the parts.
Use the percentage formula: (Part / Whole) × 100
Calculate increase or decrease: Use (New - Old) / Old × 100
Use tools when needed: A percentage deduction calculator helps save time and avoid mistakes.
Double-check your answers: Make sure calculations make sense with the data.
Real-Life Examples
School Tests: Find what percentage of questions you got right or wrong.
Business: Calculate percentage growth in sales or losses.
Surveys: Understand what percentage of people chose certain answers.
Health: Track percentage decrease in patient recovery time over months.
Practice Question
Look at this: In a survey of 200 people, 50 said they drink coffee every day. What percentage drink coffee every day? Use the formula to find your answer.
Summary
Percentage problems are everywhere in data interpretation. Understanding how to calculate and use percentages will help you interpret graphs, tables, and charts with confidence. Remember, using tools like a <a href="#percentage-deduction-calculator">percentage deduction calculator</a> can make your math faster and more accurate.
Keep practicing with real data, and soon you’ll be a data interpretation pro!